01
Every channel in one view
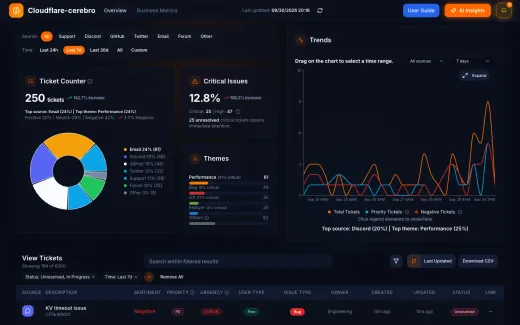
Feedback from 6 sources is normalized into one view, filterable by source and time range.
The deployed screens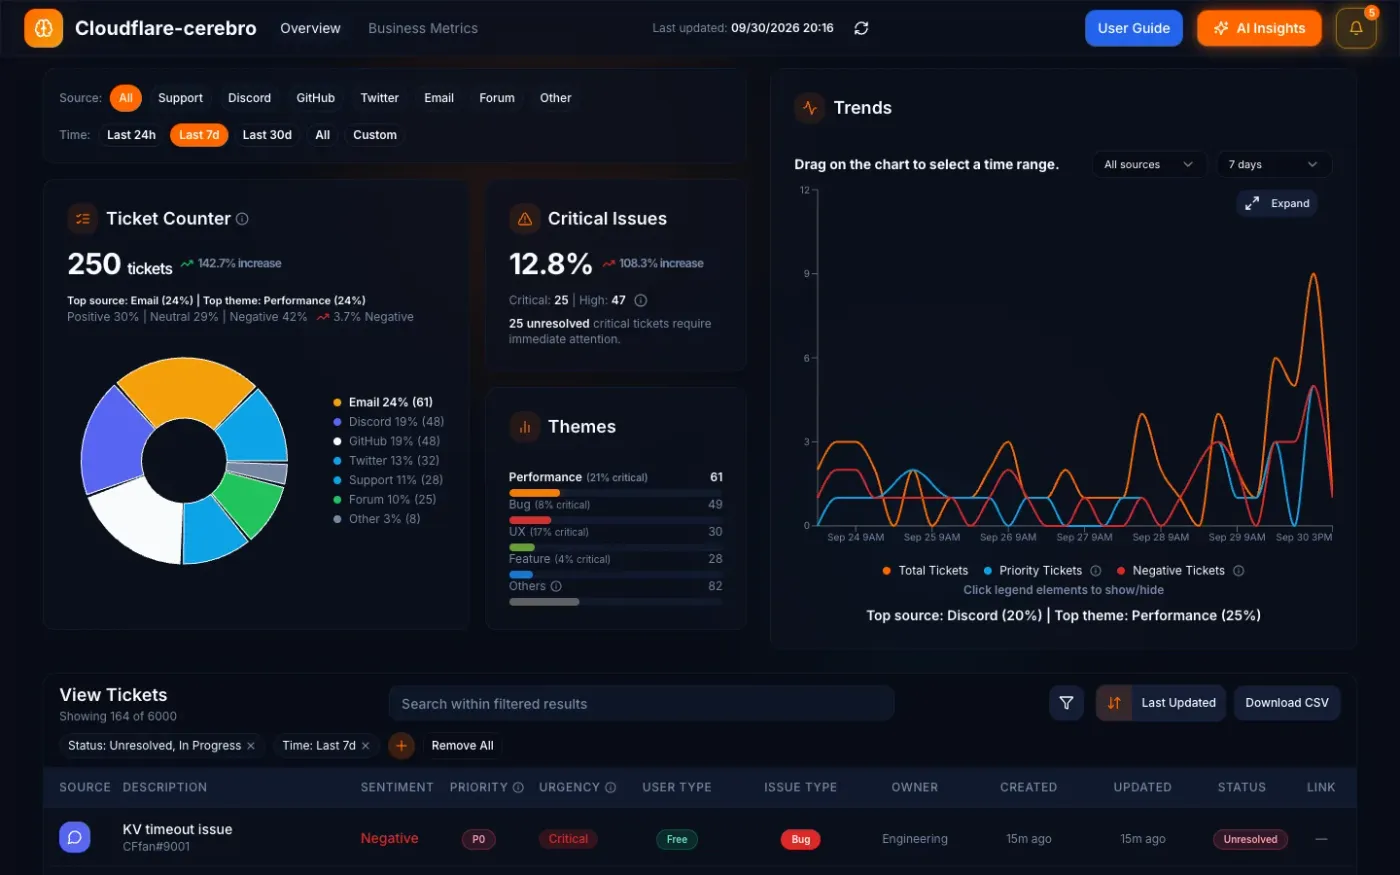
Technical build
Turning fragmented feedback into actionable signals.
A deployed feedback-intelligence dashboard that aggregates multi-source feedback and surfaces product-health signals on Cloudflare-native infrastructure.
Open Cloudflare-cerebro (opens in a new tab)View GitHub (opens in a new tab)
The assignment was to build a product that makes that signal usable, on Cloudflare.
It arrives from Support, Discord, GitHub, email and social or community channels.
Themes, urgency, value and sentiment have to be pulled out by hand.
The prototype aggregates every source into a single dashboard.
Summaries drill down to the individual feedback entries behind them.
The ideaA feedback dashboard I built on Cloudflare for a Product Manager: every channel in one view, with themes, urgency and sentiment surfaced, running as a deployed prototype on mock data.
01
Feedback from 6 sources is normalized into one view, filterable by source and time range.
The deployed screens02
A KPI strip, ticket counter, critical-issue share, theme breakdown and trend chart for the current window.
The surfaces03
AI Insights lists emerging issues and labels each as AI-generated or a fallback, so a reader knows how far to trust it.
The surfaces04
Unresolved critical issues are listed with an owner, a theme and how long each has been open.
The deployed screens05
Pages, Functions, D1, Workers AI and KV run in one ecosystem, so the prototype needed no cross-platform networking or auth.
The choices06
Building it produced a ranked friction log, and a PRD to make D1 limits explicit without changing them.
The D1 PRD1 / 5
Step 01
Source and time filters sit above a ticket counter, the critical-issue share, a theme breakdown and a trend chart, with the filterable ticket table below.
Step 02
An overlay lists unresolved critical issues from the last seven days, each with its owner, theme and how long it has been open.
Step 03
Emerging Issues show mentions, urgency change and negative share per theme. Four insight cards are written by Workers AI from the feedback data and label their own source: “AI Generated”, or “Fallback Mode” with rule-based summaries if the AI call fails.
Step 04
A snapshot of high-priority open tickets, negative feedback, resolution time, the escalating theme and ticket volume, with a negative-feedback trend and segment impact below.
Step 05
Opening any ticket shows the raw feedback entry behind a summary: its source, description, sentiment, priority, urgency, status, owner and tags.
Primary persona
Owns product quality and prioritization
Secondary persona
Owns system reliability and technical quality
Secondary persona
Owns response SLAs and ticket resolution
Real screenshots of each appear in the walkthrough below.
Synthetic feedback; no real integrations.
Implemented in the prototype
About 6,000 generated records across Support, Discord, GitHub, Email, Twitter and Forum.
The dashboard users see.
Implemented in the prototype
Routes for Overview, Business Metrics and the user guide; filtering and aggregation run in the browser.
Serverless API routes beside the frontend.
Implemented in the prototype
Pages Function returning stored feedback entries.
Implemented in the prototype
Pages Function that builds the AI Insights overlay.
Storage, AI and caching.
Implemented in the prototype
Structured system of record for feedback entries.
Implemented in the prototype
Generates insight summaries; the endpoint falls back to rule-based summaries when the call fails.
Implemented in the prototype
Caches AI-generated insights for one hour. D1 stays the source of truth.
In the design analysis, not in the prototype.
Proposed / evaluated
Asynchronous ingestion-to-analysis orchestration from the design doc. The prototype has no Workflows binding.
Proposed / evaluated
Sentiment, urgency and themes assigned by Workers AI as feedback arrives. In the prototype these come from fixed enumerations in the mock data.
Proposed / evaluated
Would replace client-side filtering as data grows beyond the current bounded dataset.
Hosts the React frontend and its Pages Functions.
The execution and API layer between the dashboard and the data.
Structured storage for feedback entries.
Generates the AI Insights summaries.
Caches derived AI insights; not a system of record.
Deliberate decisions for a prototype, each with what it bought and what it gave up.
Serverless was chosen to maximize development speed and operational simplicity for a dashboard-style workload.
D1 was selected for SQL familiarity, low operational overhead and suitability for structured, query-heavy analytics.
Mock data allowed faster iteration and clearer evaluation of the product insights; real integrations are deferred.
Filtering in the browser keeps the UI instant at the current scale of under 10K entries; server-side aggregation can follow as volume grows.
Authentication was deliberately deferred to focus on the core feedback intelligence. It is required for any production deployment.
Developers using D1 meet opaque rate limits and non-actionable errors, especially in bulk operations such as seeding and migrations.
Prioritized with the DHM model: Delight, Hard to copy, Margin moving.
High priority
A preflight layer in the CLI and API to query current limits and validate bulk operations before running them, through commands like wrangler d1 limits or wrangler d1 validate.
High priority
Errors that carry attempted versus allowed counts, a plain explanation and a fix, for example “Reduce batch size to ≤40 statements”.
Medium priority
First-class workflows for seeding, migrations and analytics ingestion, with reference implementations, batching helpers and retry strategies.
The live product, the source and every document behind this page, unedited.
Download the original documents (zip)Live product
Source code
Google Doc
Google Doc
Google Doc
Google Doc